Trading legend Jeff Clark has a warning for anyone with money in the market right now.
He calls it one of the most dangerous times of his 40-year career and a “Breaking Point” Trading Strategy is the best way to profit from it.
The Teaser
The first time Jeff saw this signal pop up was just before the 1987 Black Monday crash.
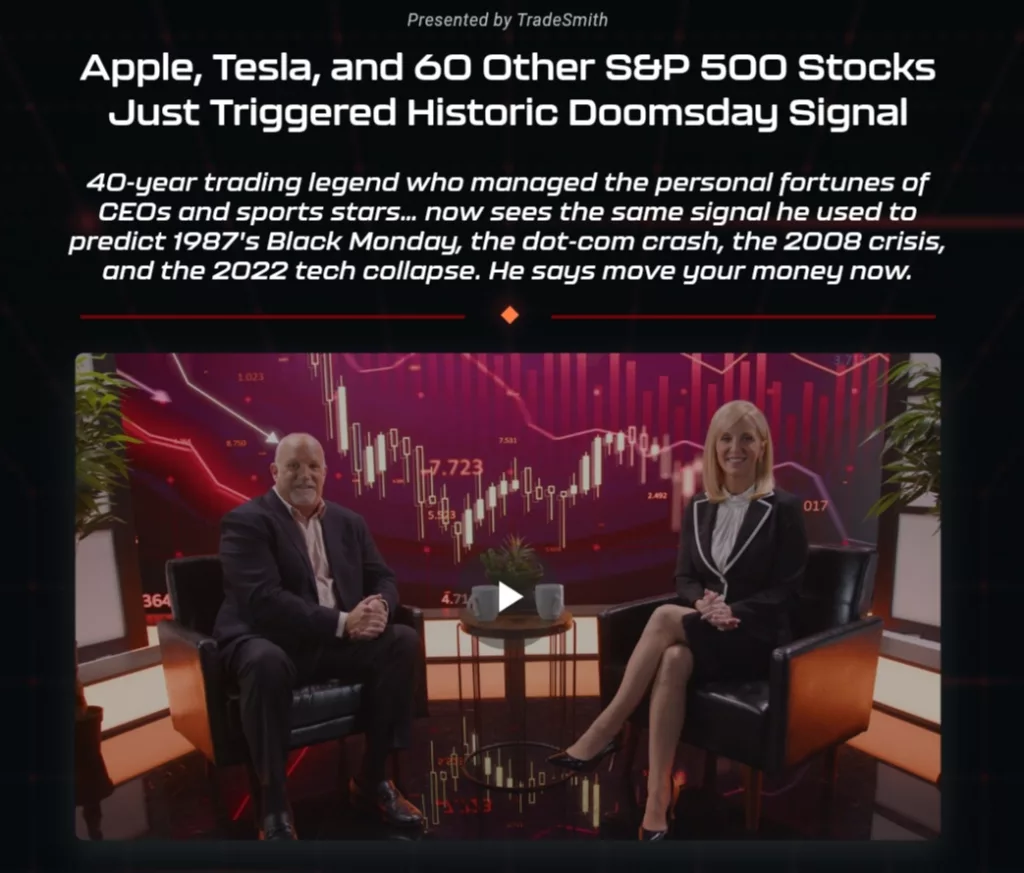
Pitch host Kim Moening calls Jeff “a brilliant financial mind” before glazing over his recent accomplishments, including 46 different trades that doubled or tripled during the 2022 tech bear market.
We're no strangers to his exploits either, having previously reviewed his One Gold Stock Retirement Blueprint and “5 Minute Money Multiplier” teasers.
The start to this one is ominous, but its not all gloom and doom, as Jeff says we can “use any market condition to our advantage, potentially doubling or tripling our money dozens of times, even if the market crashes lower.”
This is reassuring, considering that Jeff uses the B word…bubble to describe the current market.
By most metrics, he's not wrong. U.S. equities are valued at 2x U.S. GDP and 94% of global markets are trading above their long-term averages.
Jeff's own personal system for predicting crashes is flashing bright red right now.
Meanwhile, others, like Bill Gates, believe that due to Artifical Intelligence taking over the economy and making everything from energy to housing cheap or “free” on a long enough timeline, that current valuations may be justified.
Whatever side of the coin you're on, it may not matter.
Because Jeff's strategy will work for us no matter what happens to the overall market from here.
So, how exactly does it work?
It all revolves around a market signal called “The Breaking Point.”

Basically, it's a special type of trading set up that only opens up under specific market conditions…like the ones we’re seeing today.
The Pitch
As we're about to see, the math under the hood is about to get quite complex, but Jeff has put all the details in a report called The Breaking Point: How to Triple Your Money Over and Over in Any Market.
All we have to do to get it is subscribe to his weekly trading service, The Delta Report, which provides detailed step-by-step instructions on how to execute each recommended trade.
The going rate for the service is $5,000 per year, but for a limited time this has been dropped to $2,000 upfront for the first year.
The Breaking Point Explained
Here's a chart of Southwest Airlines.
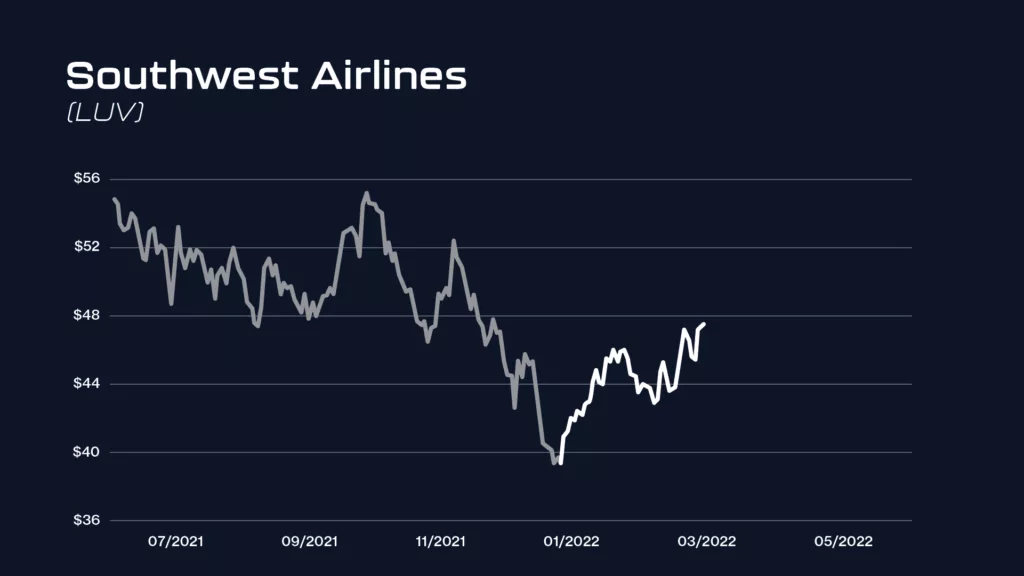
In late 2021 it started a huge move up, but there was no reason for it.
The company was losing money and air travel was still way down from pre-2020 levels.
Jeff uses this as a classic example of when fundamentals become completely disconnected from reality.
Had we made the FOMO trade into Southwest, we would have quickly lost 20% in 13 days.

However, had we known that late-stage bull runs tend to “break” back to reality, we could have made over 9x our money instead.

To identify “The Breaking Point,” Jeff uses something he says is “foolproof.”
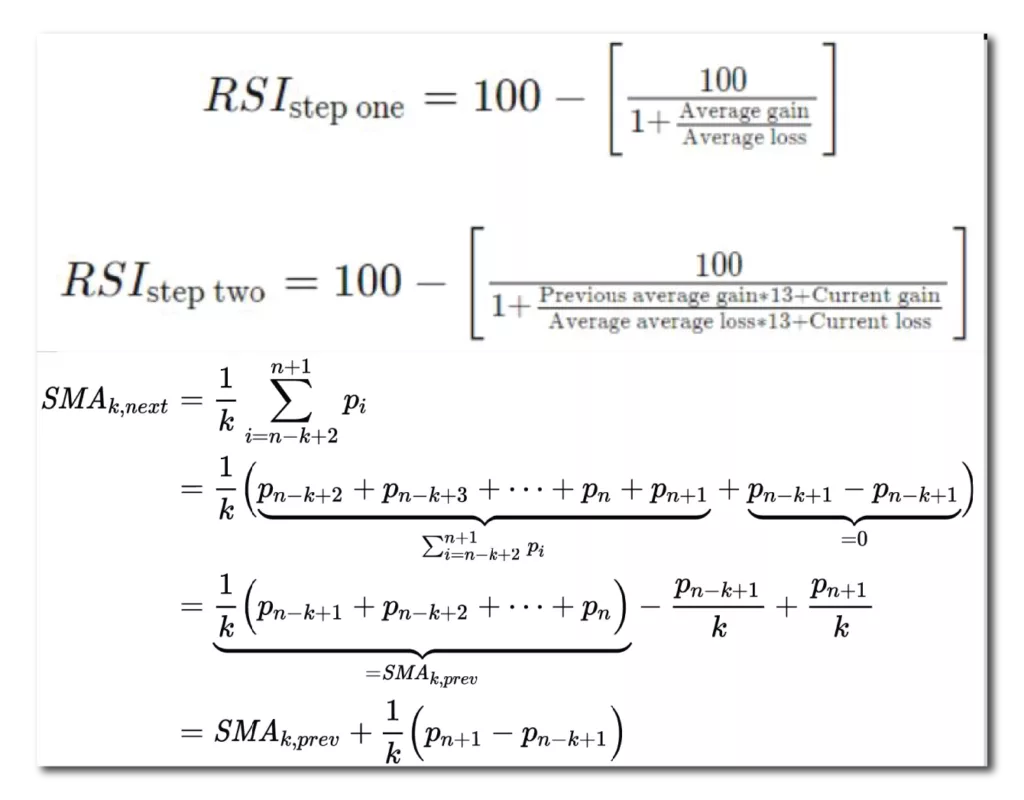
This is where things take a technical turn.
A set of three special lines, with specific parameters, are overlayed onto a price chart to observe how the price is moving relative to its history.
Palantir stock is used as an example:
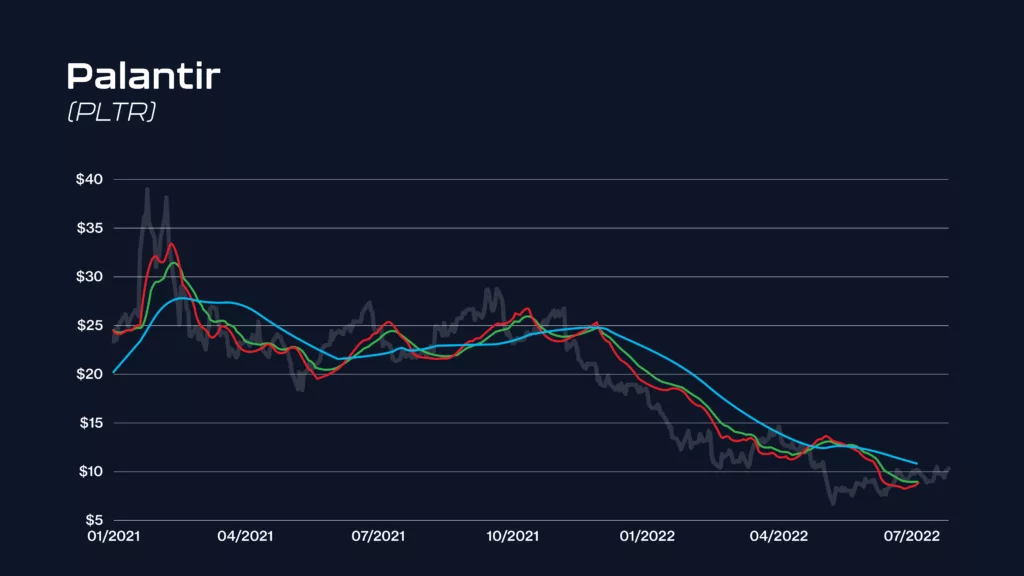
The math behind this would make John Nash from a Beautiful Mind scratch his head.
At the end of the day, when this group of complex math equations, represented as green, red, and blue lines on the previous chart all stretch out from each other, in just the right way, under just the right conditions, we get “The Breaking Point.”
If we go back to our first example, we can see this “stretching” happen in Southwest Airlines stock.
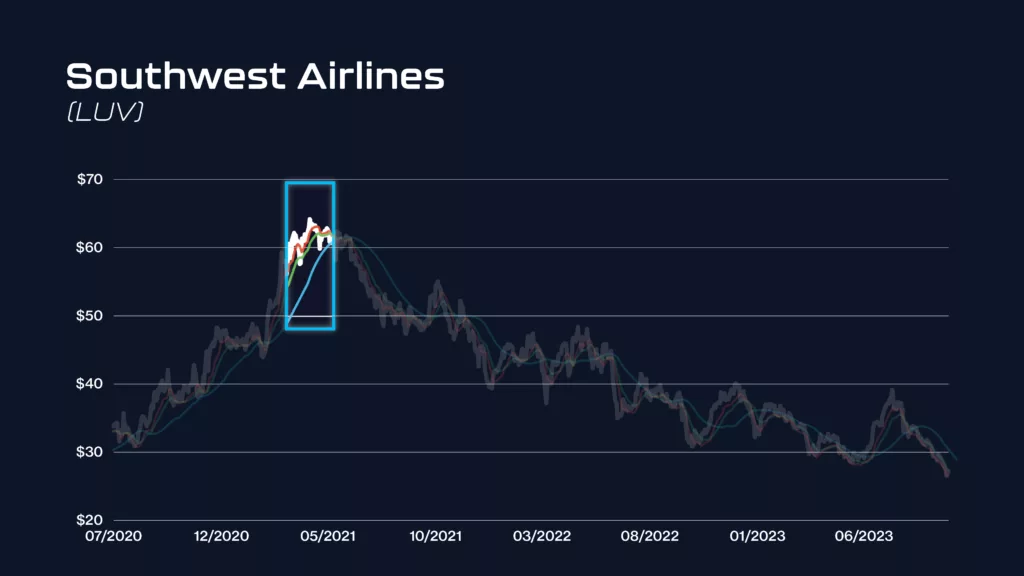
So the “stretch” indicator can give us advance warning of stock drops, got it, get it, good.
Needless to say, the strategy works best in bear markets, like the kind Jeff believes we're presently on the precipice of, and it utilizes options instead of stocks to juice returns.
Right now, Jeff's “Breaking Point” indicator has shown up in at least 60 different large-cap U.S. stocks, which are among the biggest companies in the country, including Apple.
But what other stocks should we be avoiding?
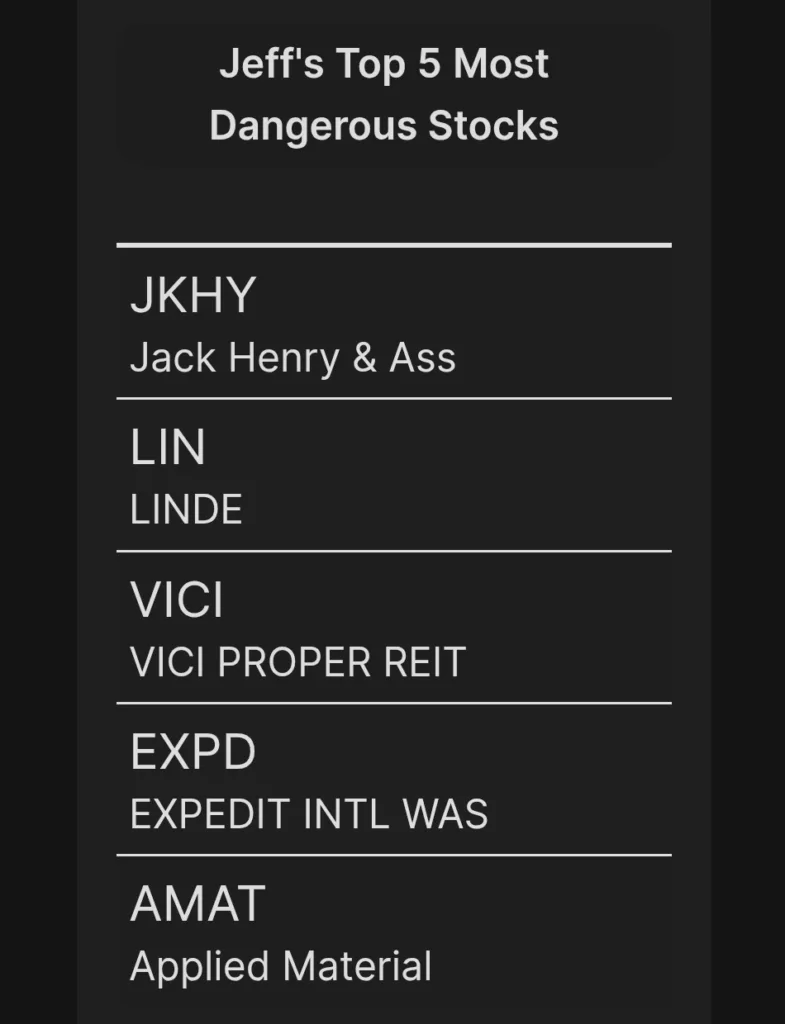
Jeff Clark's Five Breaking Point Stocks to Avoid
Jeff should have called his indicator “Breaking Bad“, but I guess the trademark was taken.
The five stocks are revealed on the order form page for The Delta Report. They're not exactly household names, save the last one, but as NYSE and Nasdaq components, they are widely held.
However, before we login to the investment account and dump these, what is the “Breaking Point” indicator's win-rate, and over what timeframe?
Make more than 1,000% every 30 Days?
It may not be as accurate as his Wife Indicator, but Jeff's “Breaking Point” still has value.
I'm not even going to try and decipher the math equations behind the method, as it was my worst subject in school. But judging by how long it's supposedly been around – nearly 40 years, it can't be all bad, can it?
The details and disclosures page was long on details and short on disclosures, so we have to make some assumptions.
Jeff has been promoting The Breaking Point since at least 2022, when he said:
The broad stock market will be bearish in the foreseeable future and most major market indexes will lose ground
Had we listened, we would have, at a minimum, missed 20%+ annual returns over the past three years.
So, as a primarily bearish indicator, it likely hasn't done all that well.
However, the kicker for me is that, as Jeff himself admits, he doesn’t recommend trying this strategy out on your own.
Towards the end of the presentation, Jeff concides that “the tools needed to use it are highly specialized and the work required to properly scan for and confirm these trades is immense.”
Instead, we are encouraged to rely on the weekly Delta Report trade recommendations, which says to me that the emphasis is on creating dependent subscribers rather than successful traders.
Quick Recap & Conclusion
- Trading legend Jeff Clark believes we are in a dangerous market and a “Breaking Point” Trading Strategy is the best way to profit from it.
- The “Breaking Point” is a three-indicator, options-based trading strategy that is primarily meant to provide advance warning of stock drops.
- The math under the hood is quite complex, but Jeff has put all the details in a report called The Breaking Point: How to Triple Your Money Over and Over in Any Market. All we have to do to get it is subscribe to his weekly trading service, The Delta Report, for $2,000 upfront for the first year (normally $5,000).
- With no publicly disclosed win-rate and “The Breaking Point” admittedly being a rather complex strategy to implement for non-professional traders. It's an easy pass for me.
Have you tried Jeff's “Breaking Point” trading strategy? Let everyone know your experience in the comments.
Just saw Ian King speaking on Elon Musk’s replacement synthetic compound for rare earth materials. Involved drilling
hair width holes in ferrite magnets and inserting dopants.
Evidently Elon announced recently that his latest Tesla models
would not contain rare earth’s. I. King said there were 3 companies as suppliers. Spoke too quick for me to write down
details. Elon making announcement January 28 th.